Integrity and Leadership

Code of Conduct
and Related Policies
Promoting Ethical Behavior
Our Company-wide ethics and compliance program is designed to ensure that integrity guides every decision we make each and every day.
Our entire workforce is required to comply with our ethics policies and procedures as well as all applicable laws and regulations.
Our Code of Conduct, our Human Rights Policy, and our Anti-Bribery and Anti-Corruption Policy apply to all Company directors, officers, and employees and set forth expectations regarding how we conduct business worldwide.
The Code of Conduct and the Anti-Bribery and Anti-Corruption Policy are administered to all new employees upon hire. All managers and supervisors complete annual Anti-Bribery and Anti-Corruption Policy training.
We maintain a confidential hotline and website to allow persons to report, without fear of retaliation, any inappropriate acts or omissions relating to our policies and practices. The hotline and website are provided by an independent third-party and are available worldwide and are translated into the local languages at each of our operations.
All hotline and website reports/inquiries are administrated by the Vice President, Enterprise Risk. To date, the significant majority of these reports and inquiries have related to employee human resources with a lesser number pertaining to safety and financial reports. The Audit Committee is informed of all hotline and website reports as well as any other matters, whether arising through the hotline, website, management, or otherwise, involving accounting, internal control, or auditing matters.
The Reliance Policy on U.S. Political Activity and Spending Practices requires that all political contributions, payments or other support to U.S. political parties, committees or candidates from corporate funds must be made in accordance with applicable campaign finance laws. Company funds or resources cannot be used for, or contributed to, political campaigns or practices under any circumstances unless pre-approved by the Company’s General Counsel. However, it is acceptable for Company employees to make lawful personal political contributions as the Company supports its employees’ involvement in the political process and their communities.
Code of Conduct
Human Rights Policy
Anti Bribery and Anti Corruption
US Political Activity and Spending Practices
Tax Transparency
We believe in having a positive impact in the communities in which we operate and we support corporate tax laws that incentivize innovation, investment, and job creation. We are committed to complying with tax laws in a responsible manner and paying and reporting our taxes on time. As part of our commitment, we do not operate in “tax havens”. We believe that a “tax haven” can be defined as a country imposing no or only nominal taxes; having a lack of effective exchange of information; and having a lack of transparency in the operation of the applicable legislative, legal or administrative provisions.
For fiscal year 2025, our worldwide income tax payments were $163.7 million, and our effective tax rate was 23.5%. Reliance also incurred $161 million in real estate, payroll, franchise, personal property and miscellaneous taxes in 2025.
Environment and Sustainability
We are committed to mitigating the impact that our products and operations may have on the environment.
We are not a metals producer or mill – we operate metals service centers. We believe that circularity and low emissions are key attributes of our business model. As a distributor and “first-stage” processor of metal products, our operations, by their nature, have a limited environmental impact as we do not emit significant amounts of carbon dioxide or other greenhouse gases.
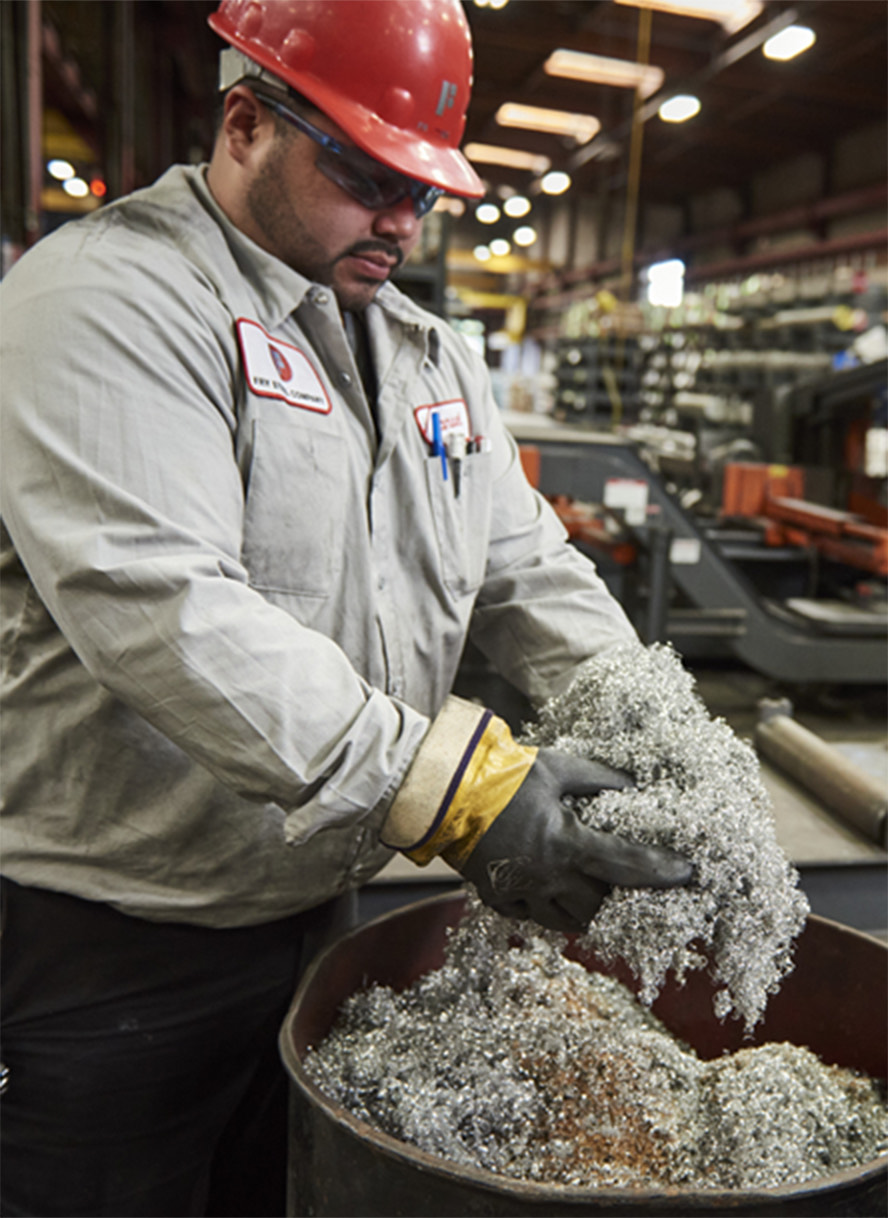
Our operations process and distribute steel and aluminum, which are inherently sustainable products, as they are some of the most commonly-recycled materials in the United States and can be 100% recycled without loss of quality.
In 2025, we reintroduced approximately 259,000 tons of recycled scrap material into the manufacturing life cycle.
As a processor and distributor of metals, and not a producer, we acknowledge and embrace our role in protecting the environment and are currently assessing our impacts. Our strong desire is to identify and prioritize areas of improvement.
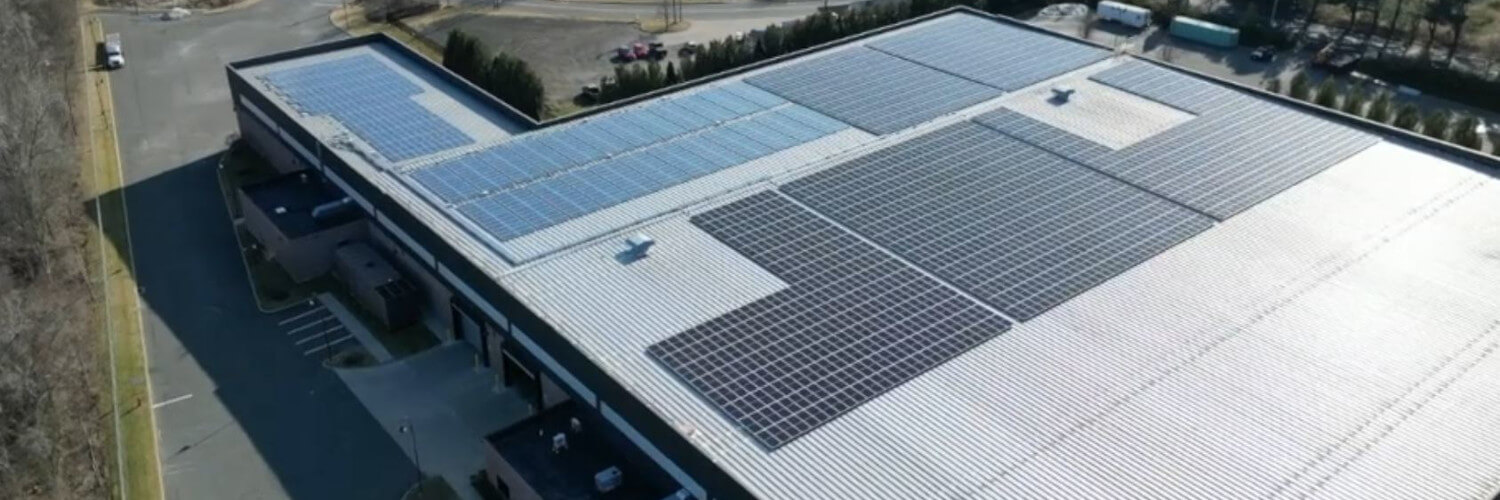
In the last five years, the Company has invested approximately $24 million in LED lighting, energy-efficient equipment and solar power equipment.
In 2026, the Company has budgeted over $4.6 million for capital expenditures related to the installation of LED lighting and energy-efficient equipment.
Greenhouse Gas Reporting Data
The following table sets forth information regarding our greenhouse gas emissions for each of the last three years ended December 31:
| Emissions Indicators | 2025 | 2024 | 2023 |
|---|---|---|---|
| Scope 1 emissions MT CO2e(1) | 195,000 | 186,000 | 186,000 |
| Scope 2 emissions MT CO2e(2) | 102,000 | 117,000 | 116,000 |
| Total MT CO2e | 297,000 | 303,000 | 302,000 |
| Greenhouse Gas Intensity by Revenue(3) | 20.8 | 21.9 | 20.4 |
(1) Scope 1 emissions (in metric tons of carbon dioxide equivalent) represent direct greenhouse gas (GHG) emissions resulting from fuel consumed to operate our fleet of trucks and facilities. As a distributor, approximately 75% of our Scope 1 emissions arise from fuel consumption for product delivery. Scope 1 (GHG) emissions are derived from our fleet of approximately 1,900 trucks, over 320 locations and 38.6 million square feet of facility space.
(2) Scope 2 emissions (in metric tons of carbon dioxide equivalent) represent indirect GHG emissions from purchased electricity. Emissions at each facility vary based on amount of energy purchased and emissions efficiency of grid energy source.
(3) The greenhouse gas intensity by revenue metric is the sum of our Scope 1 and location-based Scope 2 emissions in metric tons of carbon dioxide equivalent divided by our revenues (in millions).
The following table sets forth information regarding our Greenhouse Gas Intensity by Total Tons Transacted for each of the last three years ended December 31:
| Emissions Indicators | 2025 | 2024 | 2023 |
|---|---|---|---|
| Greenhouse Gas Intensity by Total Tons Transacted(1) | 21.5 | 22.7 | 23.4 |
(1) The greenhouse gas intensity by total tons transacted metric is the sum of our Scope 1 and location-based Scope 2 emissions in metric tons of carbon dioxide equivalent divided by the aggregate of our tons sold and tons toll processed (in thousands of tons).